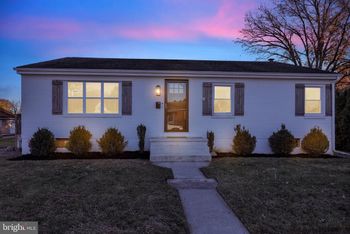
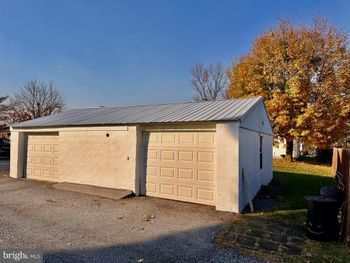
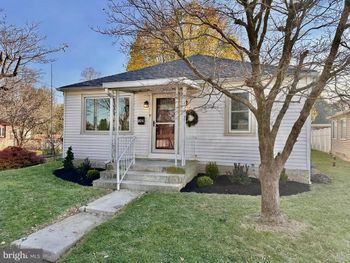
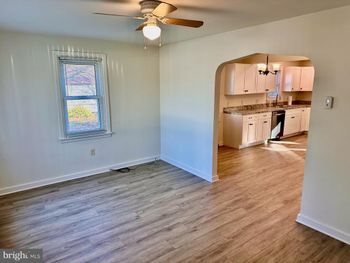
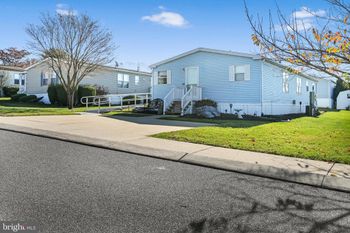
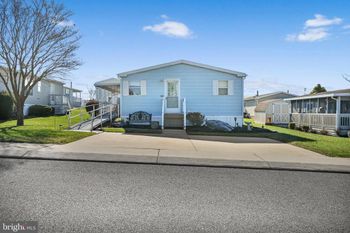
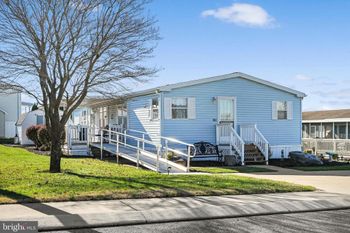
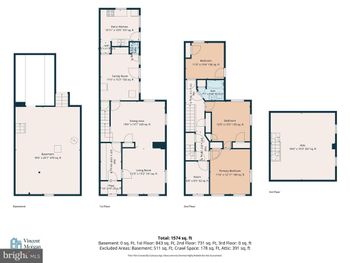
New - 6 Hours Ago
$249,000
Active
5
Beds
2
Baths
1765
Sqft
0.11
Acres
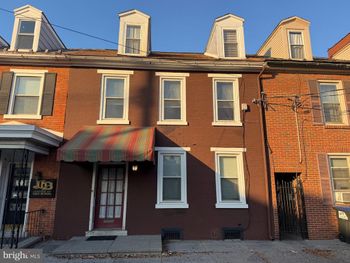
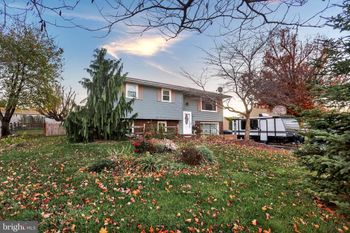
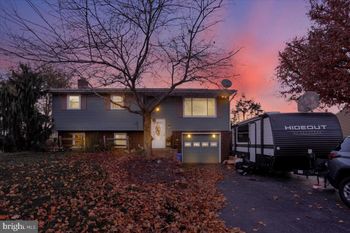
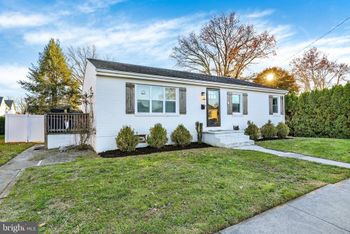
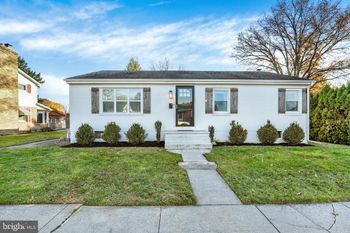
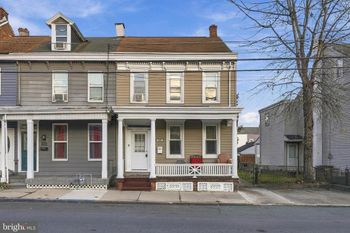
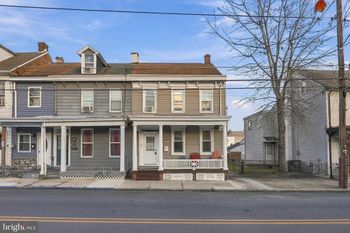
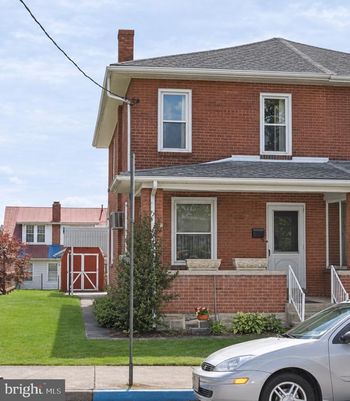
1242 E Old Cumberland St, Lebanon, PA 17042
MLS#: PALN2029778



By Michael Orta Team | Checked November 6, 2026 EST
Lebanon County’s housing market does not fit neatly into a single “hot” or “cold” label. In the September 2026 figures published by Bright Research, the county’s median sold price was slightly higher than a year earlier, completed sales were lower and new pending sales were higher. Those measures describe different parts of the buying and selling process, so they can move in different directions without contradicting one another.
This update uses one primary source: Bright Research’s September 2026 Central Pennsylvania Housing Market Report, with data as of October 6, 2026. [1] September is the latest primary county-level monthly report verified for this article during our November 6 review; that does not establish that no newer report exists. The reporting month appears in the headline so readers do not mistake these figures for live November inventory or a forecast for next year.
In the report’s local-market comparison tables, Lebanon County recorded:
These are county figures, not statistics for the City of Lebanon alone. A property with a Lebanon mailing address may sit outside the city, and a county-wide median can include homes in very different settings. The same caution applies when you compare a downtown property, a home in Palmyra and new construction in Cornwall.
The median sales price is the middle value among the sales in the report. It is not an appraisal of every house in the county. The mix of homes that closed during a month can influence the result: different property sizes, conditions and locations can shift the midpoint even when your own home’s likely value changes differently.
For a seller, the reported 0.7% annual increase is a reason to look carefully at relevant comparables—not permission to add 0.7% to any previous estimate. Recent closed sales, current competition, condition and property-specific features all belong in a pricing conversation. An unusual lot or a substantially different renovation history may make a nearby sale less useful than it first appears.
For a buyer, the county median is similarly not a required offer amount. Your decision should be based on the particular home, the financing you qualify for and the terms you are comfortable accepting. County context can inform the discussion without replacing it.
Closed sales count transactions that reached completion during the reporting period. New pending sales capture contracts earlier in the process. A transaction can go under contract in one month and close in another, and not every contract reaches settlement.
That is why September’s lower closed-sales count and higher pending-sales count should be read as two observations rather than blended into one prediction. The report records fewer completed sales than a year earlier, alongside more newly pending activity. It does not tell us that every pending home will close, or that the same pattern will continue throughout winter.
If you are planning a move, this distinction can help you ask better questions. Are homes comparable to yours getting showings? Are they going under contract? What price adjustments or terms preceded those contracts? The county table starts the conversation; a focused property review adds the useful detail.
The reported median of 14 days on market was four days longer than in September 2025. That indicates a change in the midpoint of the recorded marketing periods. It does not mean every buyer has two weeks to decide, nor does it guarantee a seller a contract within two weeks.
A well-matched home may require a different response from a property that has been available longer or needs substantial work. Buyers can prepare by discussing financing and priorities before a suitable listing appears. Sellers can prepare by making presentation and pricing decisions before launch instead of waiting for a broad statistic to solve a property-specific problem.
For either side, a contract also has terms beyond price. Financing, inspection provisions and settlement timing deserve attention. No county statistic can tell you which combination of those terms is right for your situation.
Bright’s same report gives the broader Central Pennsylvania region a September median sold price of $315,000, with 2,418 closed sales and 11 median days on market. [1] Those regional figures are not Lebanon County’s figures.
Keeping geography straight is especially important in a region where people often compare homes across county lines. A broader regional summary can be useful background, but it should not be relabeled as a Lebanon County update. We also avoid averaging neighboring counties’ medians into a homemade regional number.
Different websites may publish different totals because they use different reporting windows, property selections, data sources or update dates. For that reason, this article does not mix a portal’s rolling-period price with Bright’s single-month sales count. If a future update uses a different source, the change should be explicit.
If you are selling, start with a property-specific review and a practical preparation plan. Our seller page explains how to request a valuation conversation. A comparative market analysis is not an appraisal, but it can help organize the relevant sales and current competition.
If you are buying, use the Lebanon County guide to compare communities and the home search to review current options. Keep your total budget and preferred features separate from a county-wide headline. If you are considering a new home, check the development guides and confirm current builder terms directly.
The useful takeaway is not a dramatic prediction. September’s verified report shows modest year-over-year movement in the county median price, fewer closings and more new pending sales. Your next step is to connect that context with the specific home and timeline you are considering.